


Modified: October 19, 2021
Reports are classified into two types:
- Performance Reports 2. Usage Reports
1. Performance Reports
These reports mainly extract the performance report by month and by day with respect to the subject.
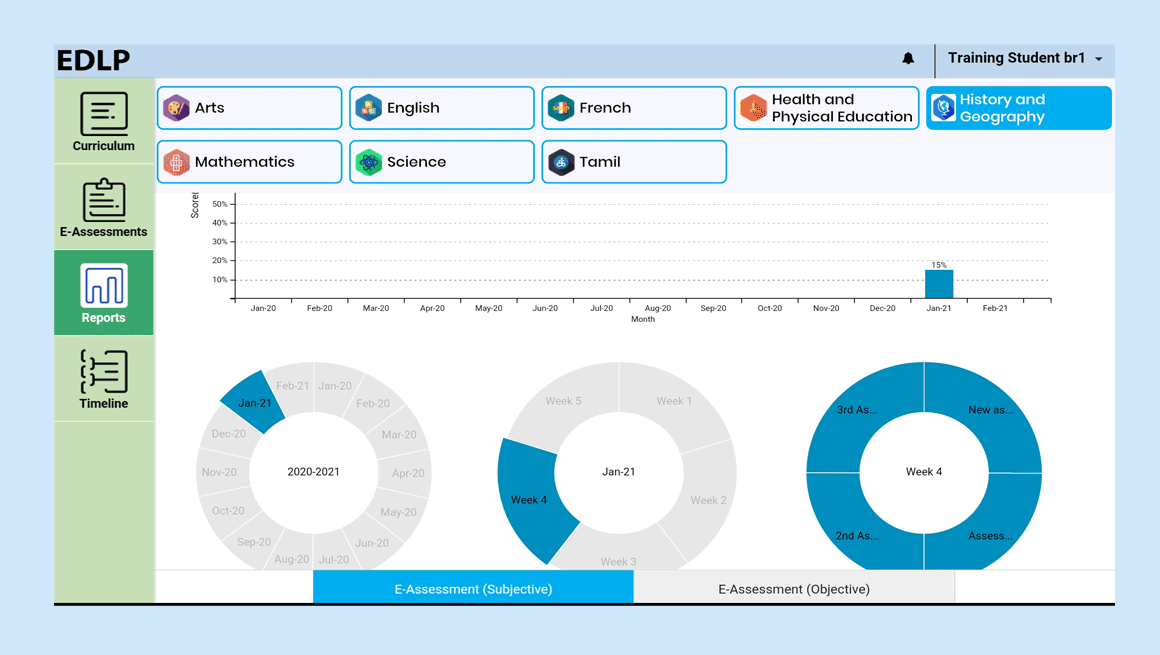 Pic 01: Performance report by month
Performance is measured in the following two areas
- E-Assessment (Subjective)
- E-Assessment (Objective)
When Teacher assign marks to your submitted subjective/objective e-assessments, then automatically performance Reports are generated with respect to the percentages.
Reports are represented via donut graphs, under the bar graph. The first donut graph shows “Present Academic Year”. The second donut graph shows “Selected Month with Week” selection, and the third donut graphs represents “Selected Week” activities. If you hover over an activity, the name of Activity and percentage is displayed. Double click on any activity to display additional score details.
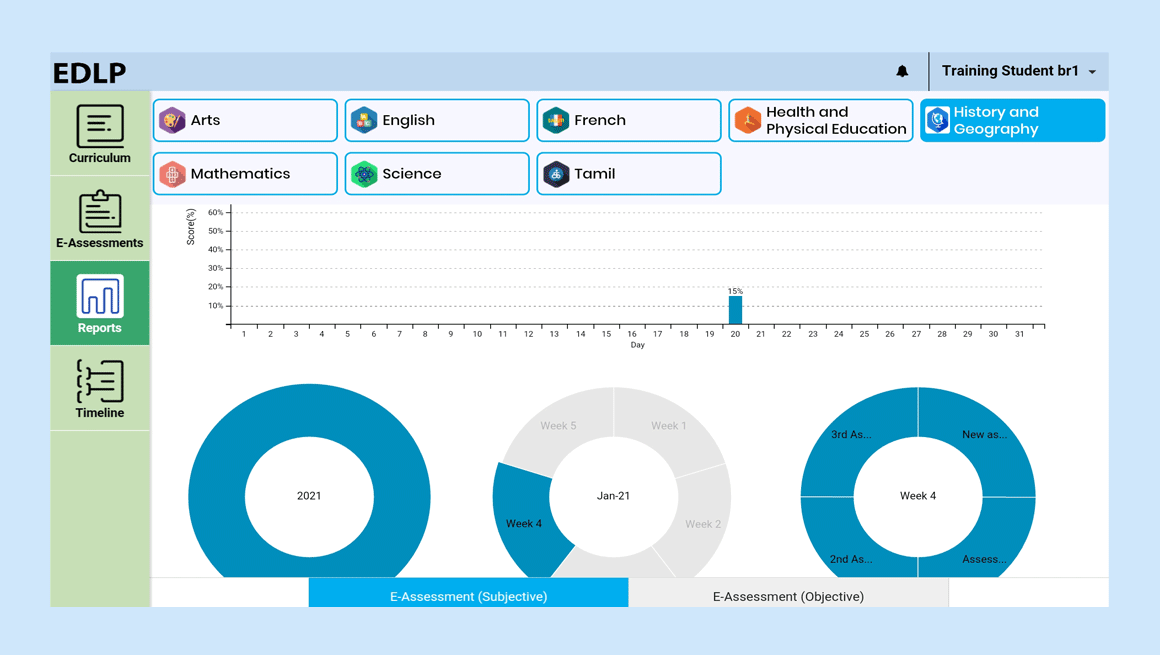 Pic 02: Performance report by day
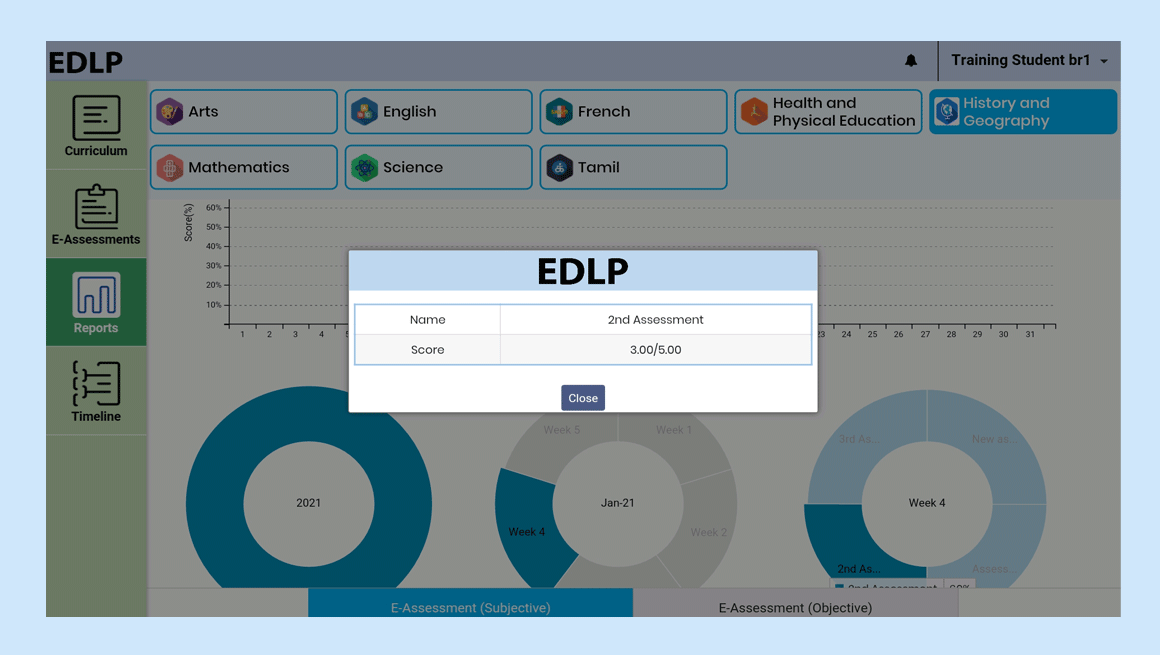 Pic 03: View score details of an E-assessment
2. Usage Reports:
These reports represent the Usage (quantitative time spent calculated in minutes and seconds) of E-Assessments (Subjective and Objective), Curriculum modules.
The default setting for viewing “Usage Reports” is “by Month”. This can be changed on basis of “by Day” usage by double clicking on the bar graph as well.
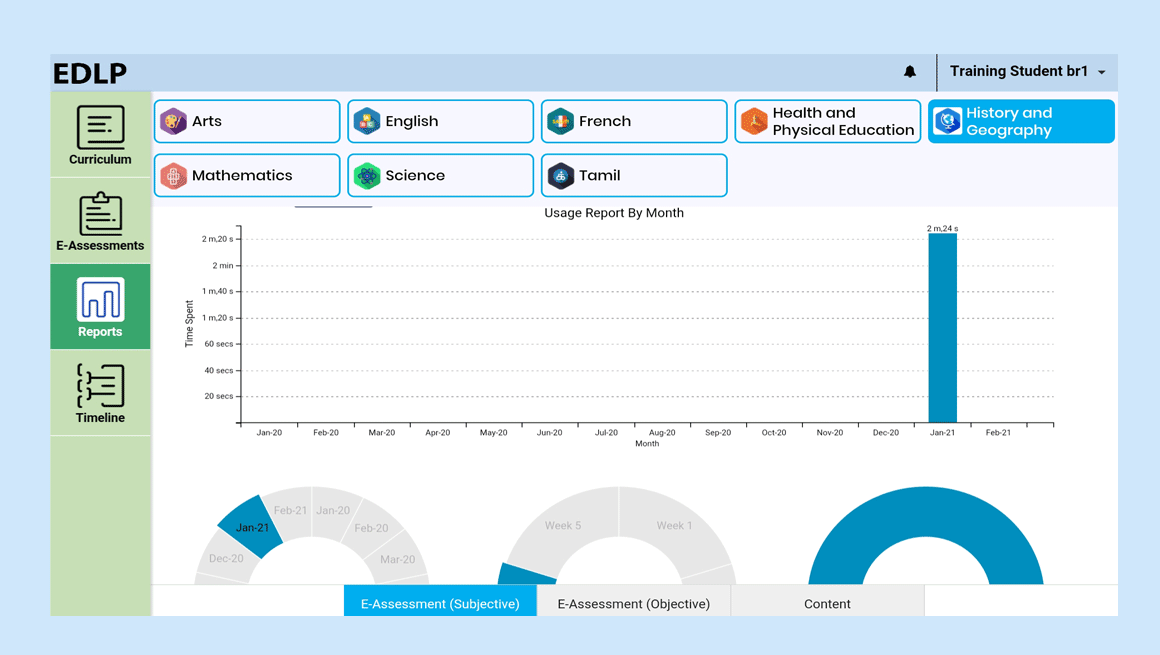 Pic 04: Usage report of a student by month
Usage Reports are measured across the following parameters:
- E-Assessments – Objective
- E-Assessments – Subjective
- Content
Reports are represented using donut graphs, where the data presented is based on academic year, month wise and week wise. (Similar to Performance reports).
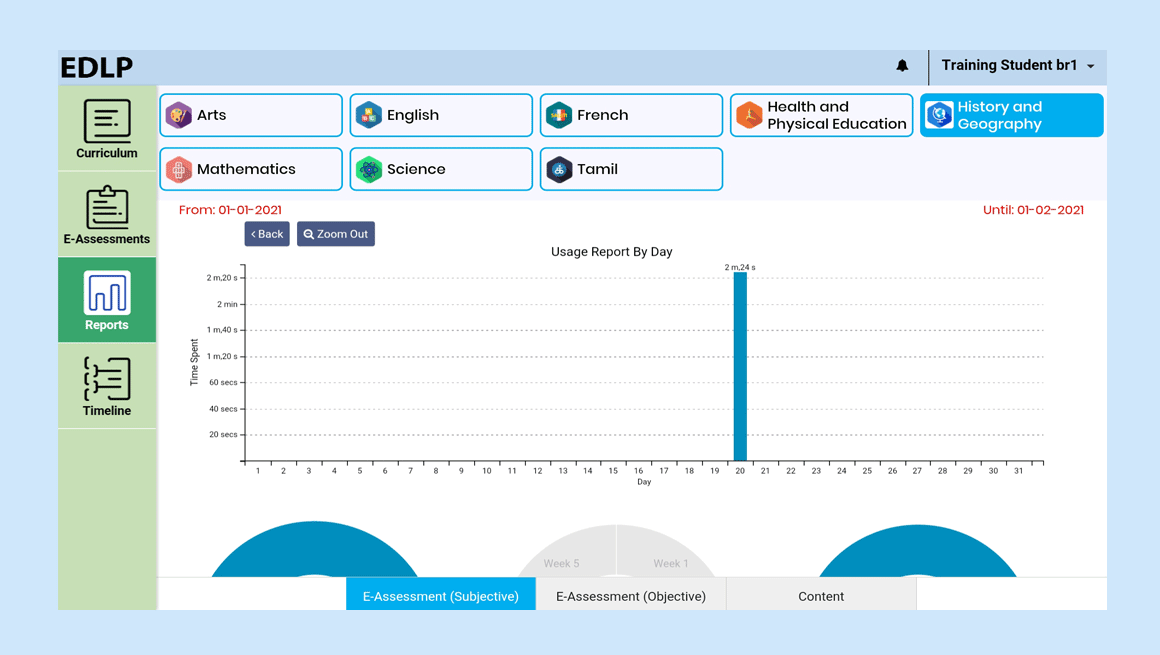 Pic 05: Usage report of a student by day