


Modified: October 19, 2021
This module can be used to view Performance and Usage reports of each Student. Reports have two sub-modules namely:
1. Student Reports
Through this module, you can view performance and usage reports of the students. Filtering of the data can be done using Name and Class fields. The table shows following details:
- Name: denotes the name of the student
- Class: denotes the class student is currently enrolled in
- Reports: two types of reports can be viewed from here i.e., Performance and Usage. Click on the respective radio buttons to navigate to the required Reports type.
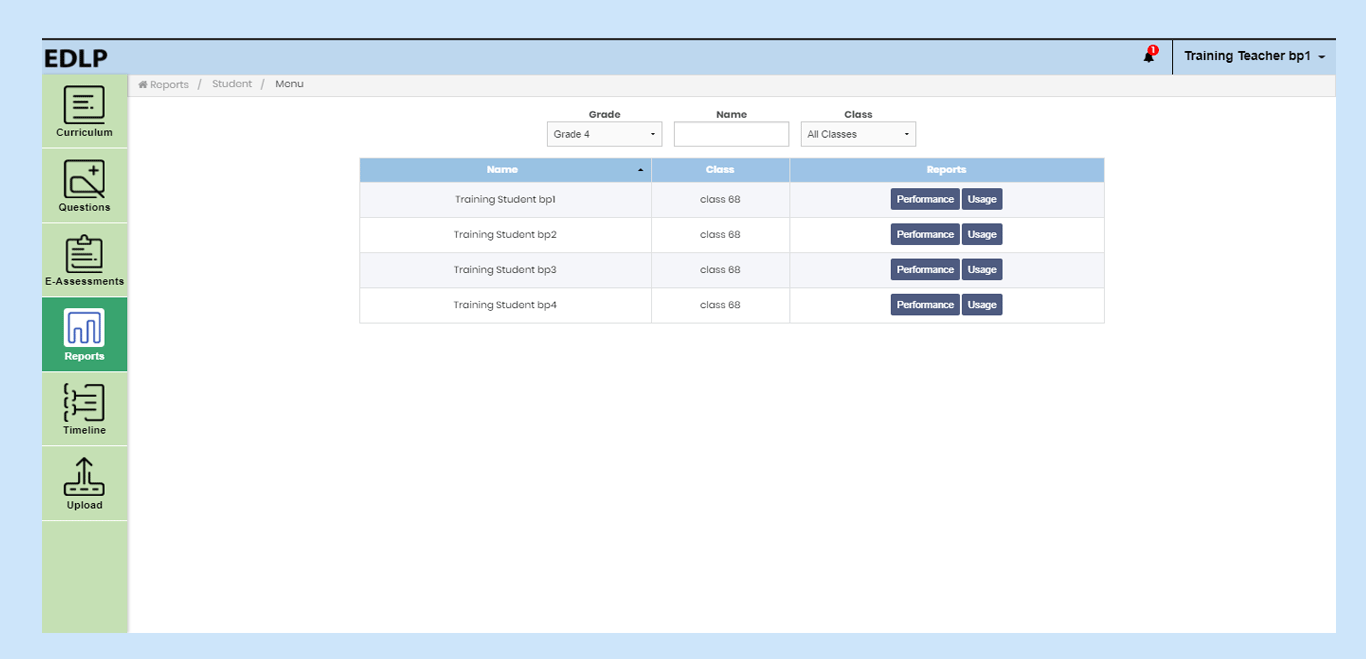 Pic 01: Student Reports
2. Performance Reports:
These reports mainly extract the performance report, month wise of the individual student pertaining to a single subject.
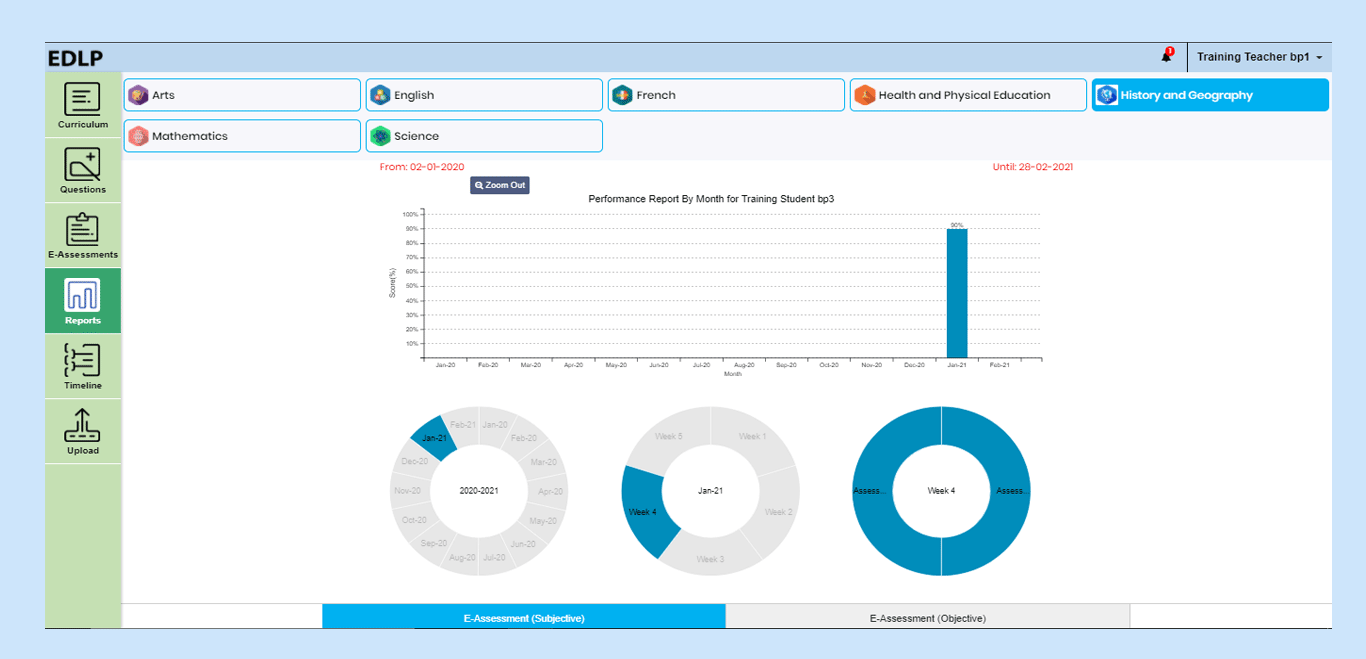 Pic 02: Performance report of a student by month
Performance reports are measured across two parameters:
- E-Assessments – Subjective: These reports are generated when a student submits a subjective E-Assessment and you allot appropriate grade to that assessment.
- E-Assessments – Objective: These reports are generated when a student submits an objective E-Assessment and the marks are graded automatically.
Reports are represented via donut graphs, under the bar graph. The first donut graph shows “Present Academic Year”. The second donut graph shows “Selected Month with Week” selection, and the third donut graphs represents “Selected Week” activities. If you hover over an activity, the name of Activity, and percentage is displayed. Double click on any activity to display additional score details.
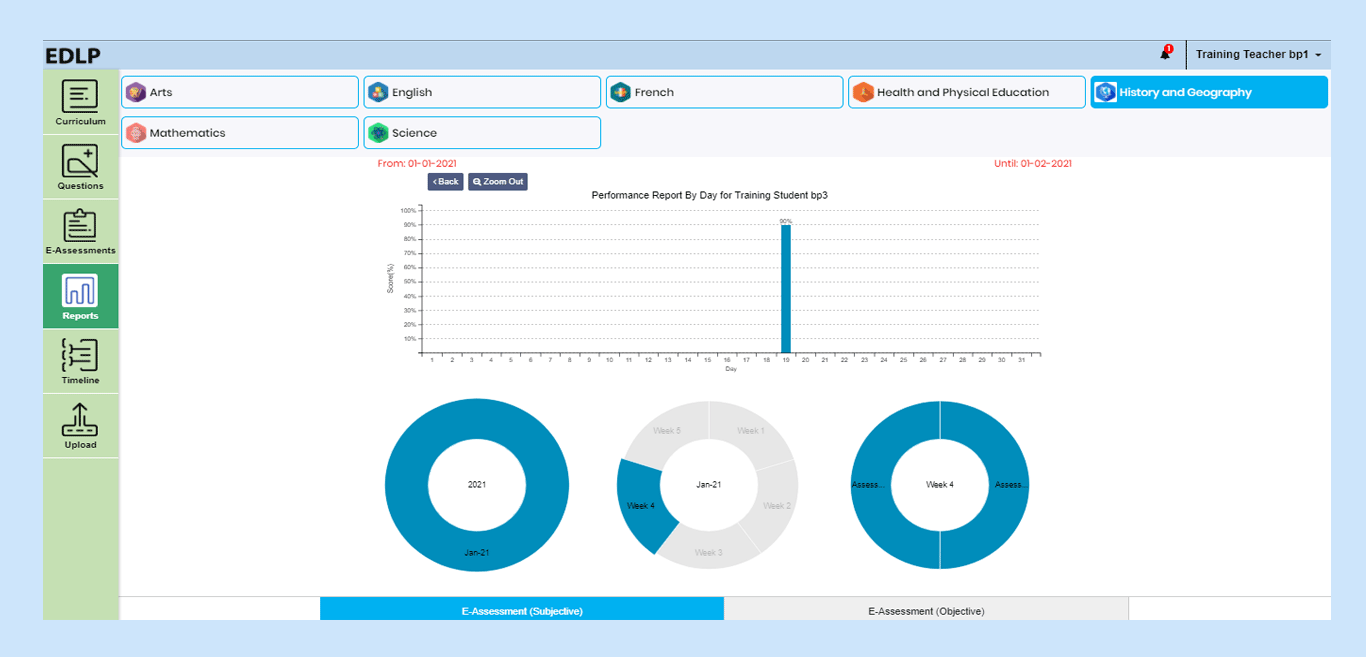 Pic 03: Performance report of a student by day
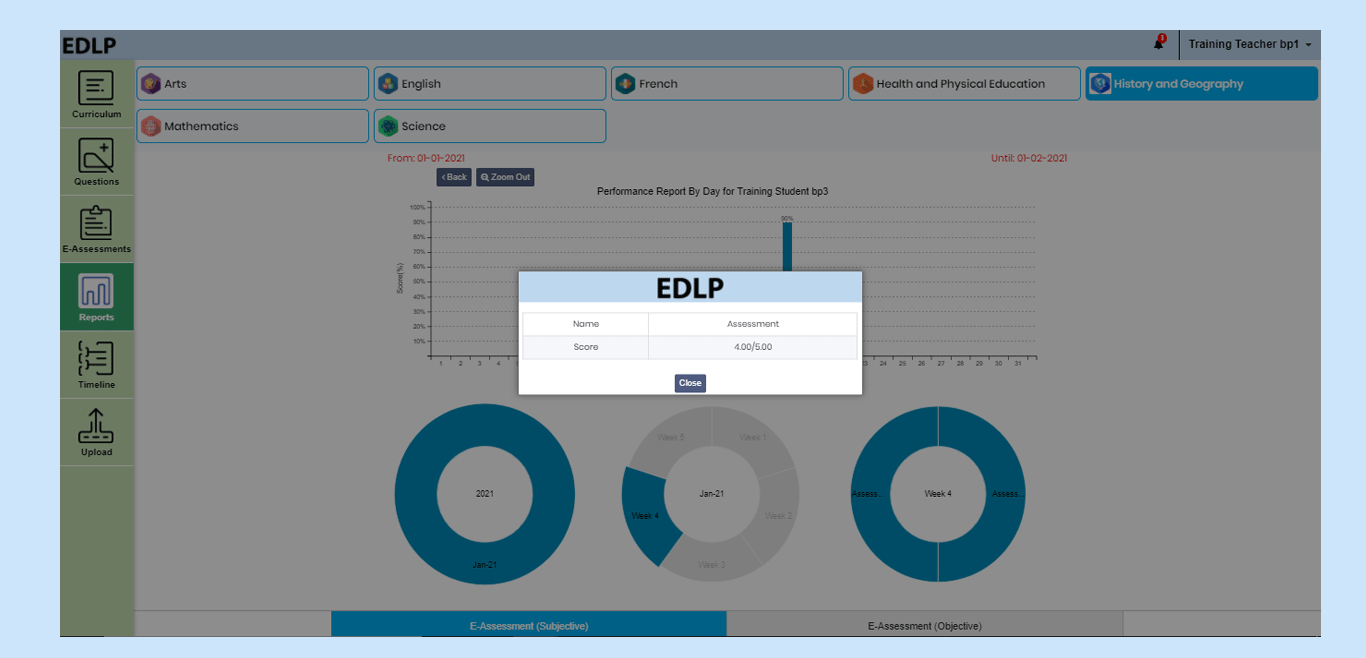 Pic 04: View score details of an E-assessment
3. Usage Reports:
These reports represent the Usage (quantitative time spent calculated in minutes and seconds) of E-Assessments, Curriculum modules.
The default setting for viewing “Usage Reports” is “by Month”. This can be changed on basis of “by Day” usage as well.
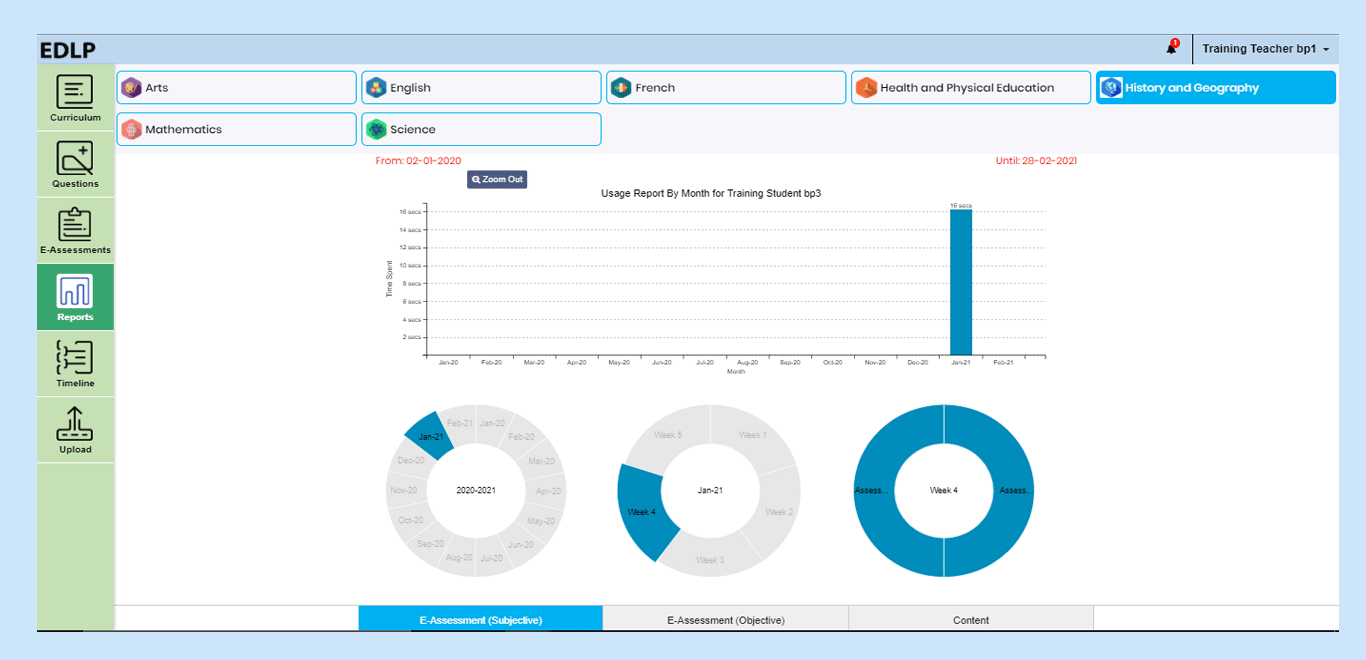 Pic 05: Usage report of a student by month
Usage Reports are measured across the following parameters:
- E-Assessments – Objective
- E-Assessments – Subjective
- Content
Reports are represented using donut graphs, where the data presented is based on academic year, month wise and week wise. (Similar to Performance reports).
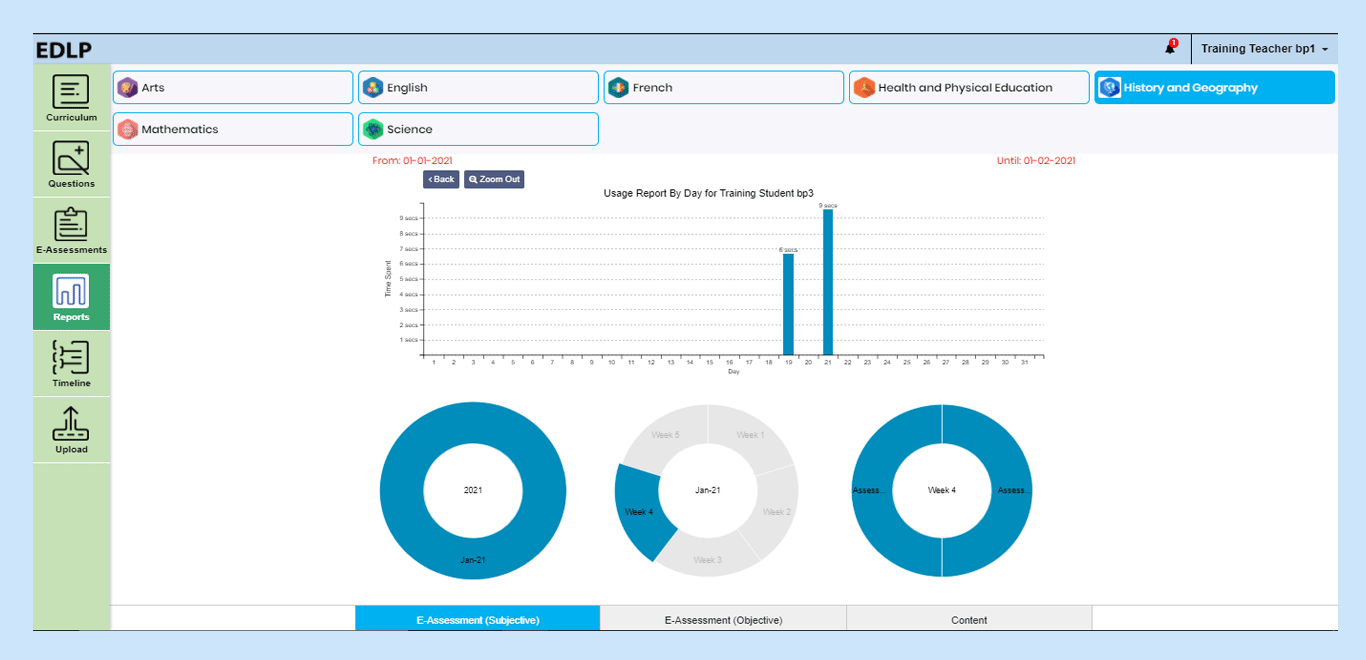 Pic 06: Usage report of a student by day
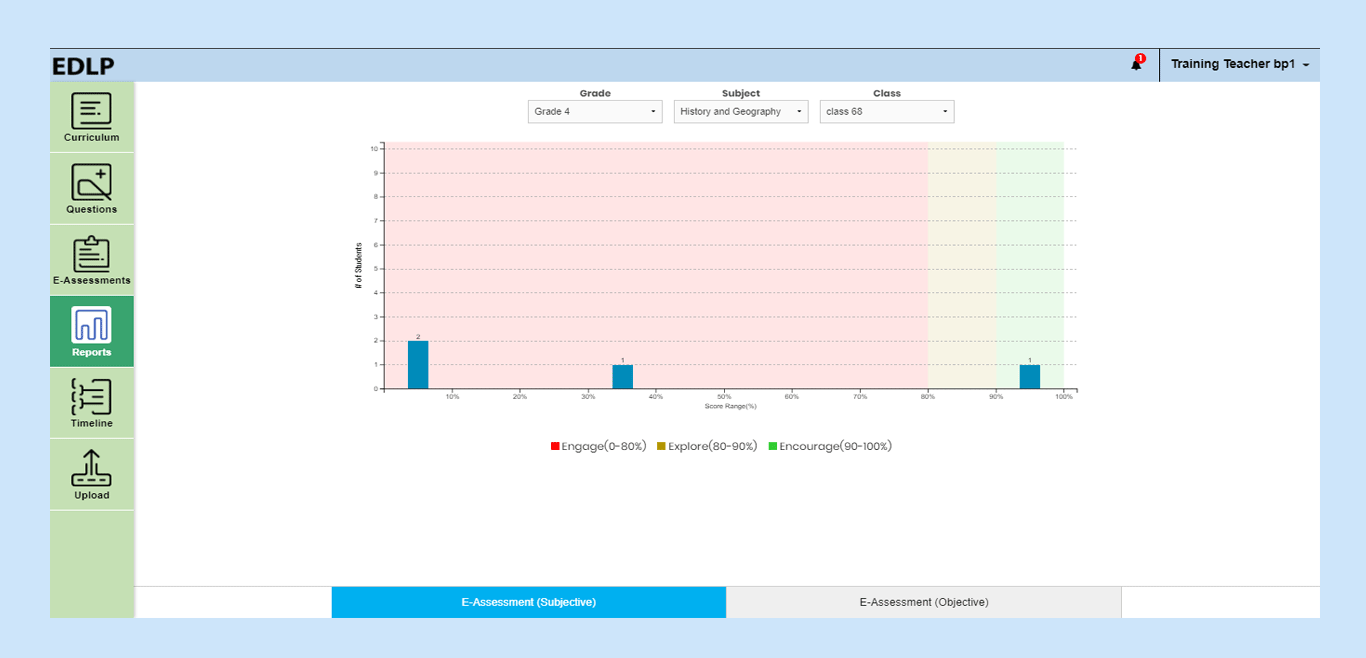
4. Grade Reports
This module can be used to have an overview of grade reports between the two E-Assessments Subjective and Objective. Data can be filtered using Subject and Class fields.
 Pic 07: Grade Reports
Bar Graphs represent grade reports where:
- X-Axis signifies Score Range in terms of %
- Y-Axis signifies the total number of test taking students
Double click on the bar graph to view performance reports of the students in a selected range.
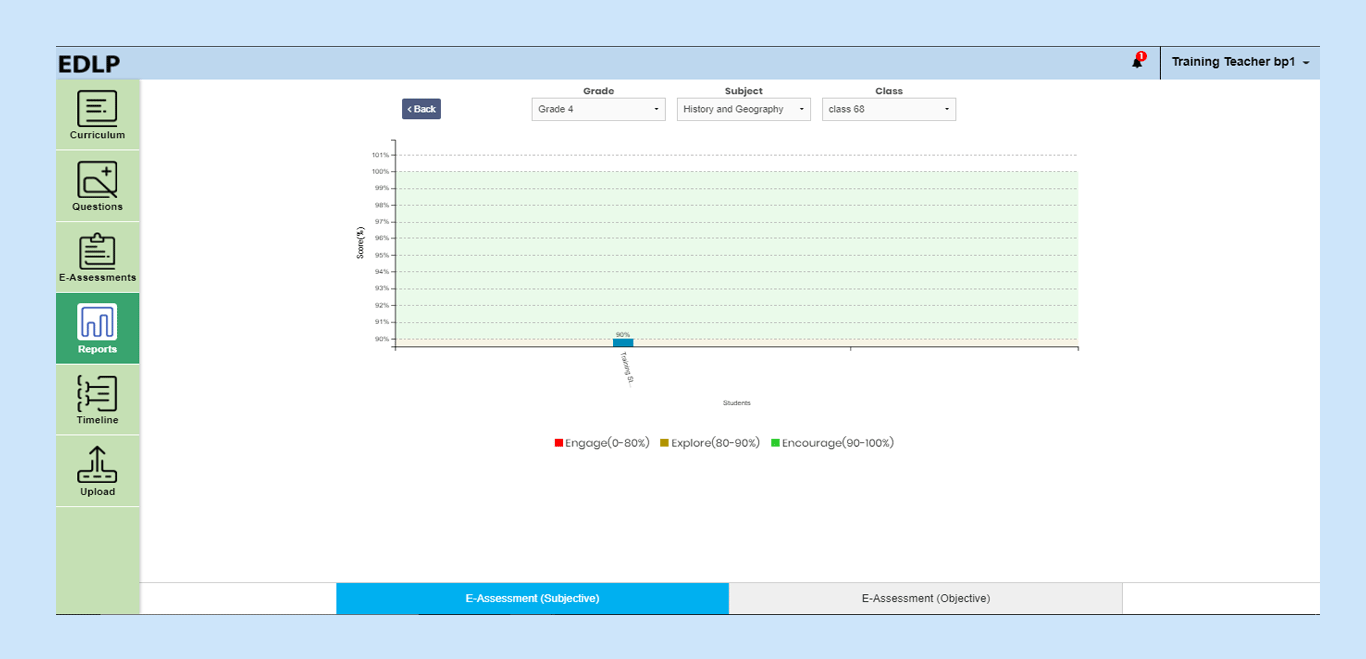 Pic 08: Grade Reports in some score range